
Risk management
Welcome to the Risk Management Module of Brainframe, the essential tool for safeguarding your organization's valuable assets. In today's fast-paced digital landscape, proactive risk management is not just recommended; it's imperative for maintaining a robust security posture. Our Risk Management Module has been meticulously designed to fortify your organization's defences by enabling a thorough and dynamic approach to managing and mitigating risks.
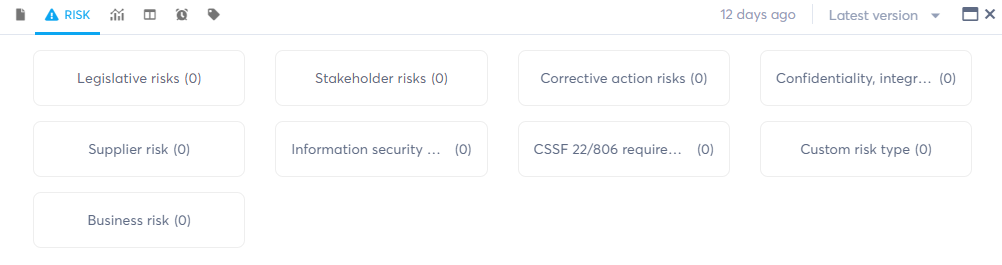
The way risks are tracked inside Brainframe is always the same, but we give you full flexibility to set up the different risk types, methodologies and measures you want to track. This can go from prioritizing stakeholder based on risk importance to supplier evaluation, as well as the classic Confidentiality, Integrity and availability risks as used in popular standards like ISO27005.
How create a risk
A risk in Brainframe is simply a document that describes the risk in details with the information that has been found during a risk assessment (e.g. scenario description, risk owner, likelihood/impact, risk level, existing controls, mitigations, ...). Such risk assessment can be done in your favourite dedicated tools, Excel or using our assisted document type "Risk assessment". The challenge is in prioritizing and managing these risks, in relation to your assets, and this is where Brainframe excels.
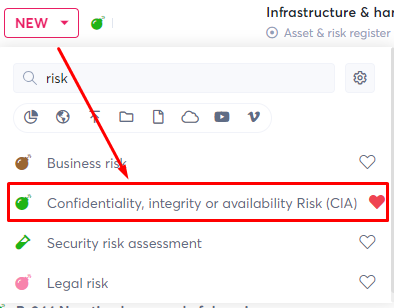
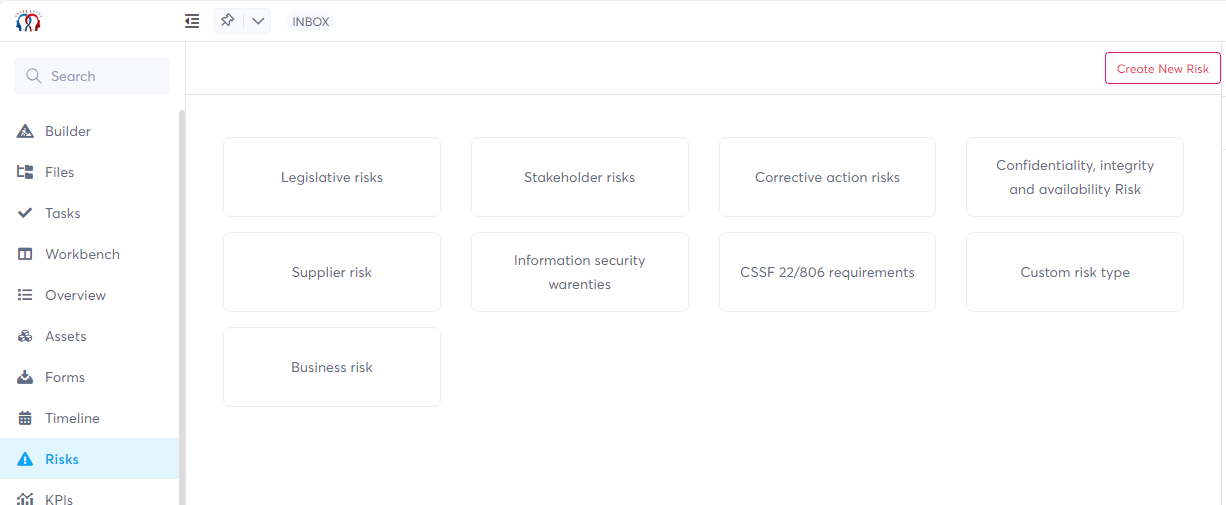
To create a new risk, simply search for the pre-defined document type "Confidentiality, integrity or availability Risk (CIA)"
This will open the new document of type "Confidentiality, integrity or availability Risk (CIA)" with all the pre-configured settings:
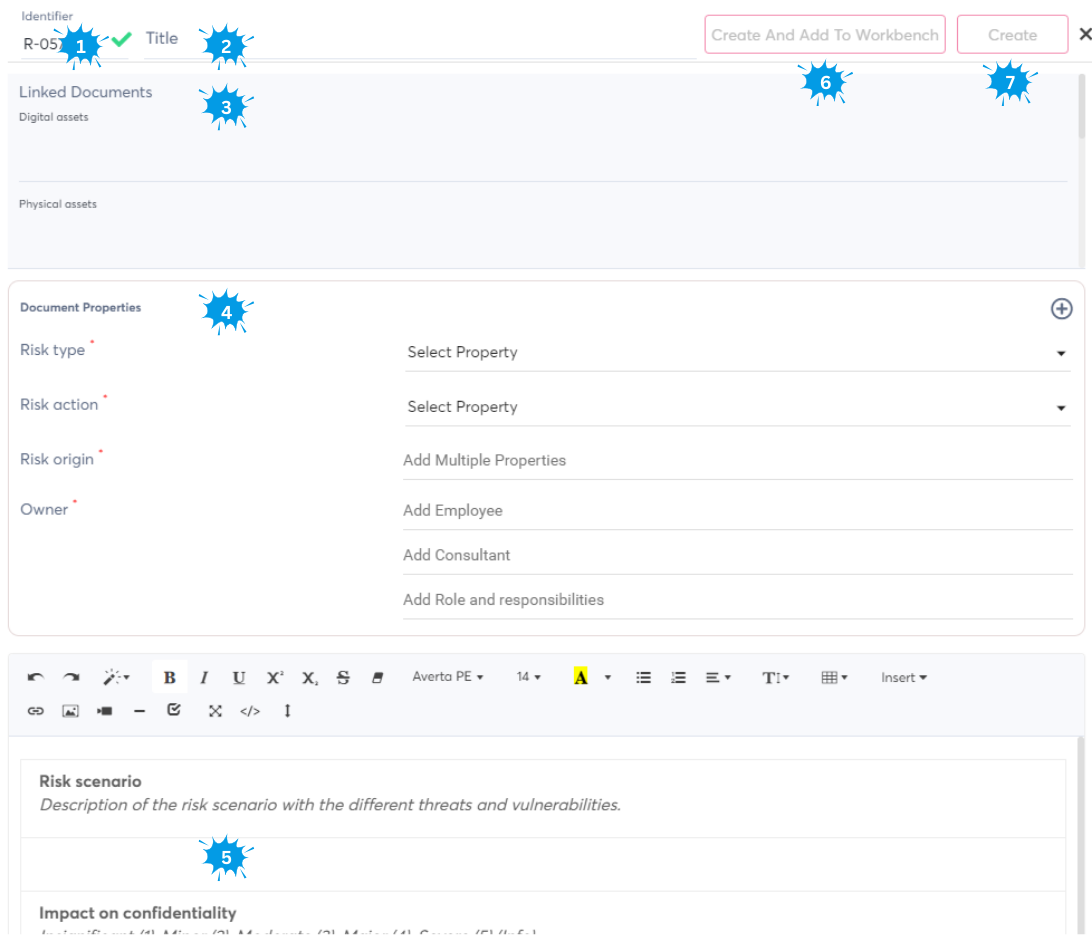
- A unique incremental identifier where our system ensures that it is not in use already (default is R-00x, but you can create your own)
- A title for your risk
- Risks can apply to different elements of your information management (e.g. system, assets, policies, suppliers, ...), and here you can quickly link the current risk to the documents representing the items at risk. There will be a two way link, allowing you to quickly see related risks when opening specific documents
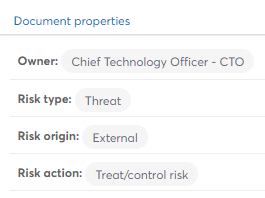
- Risks come with certain repeating document properties that allow to group different risk types together. Our risk document type comes with following pre-configured properties
- Risk type: Threat/Opportunity
- Risk action: Treat/control risk, Terminate risk, tolerate risk, transfer risk, or a combination of actions
- Risk origin: Internal and/or external
- Owner: Link to another document in your workspace that represents either an employee, consultant or role and responsibility (we recommend the latter, because it avoid updating all documents when a person changes role)
- This is the risk description template that comes built in by Brainframe. If you want you can also create your own templates (even Word/Excel documents), to align with your way of working
- Here you can create the risk as a document, and immediately add it to a specific checklist on the workbench (see more info at bottom of page why this could be interesting)
- This is to simply create the risk document
Below is an example of a risk on DDoS where you can see how it looks once the risk it is created:
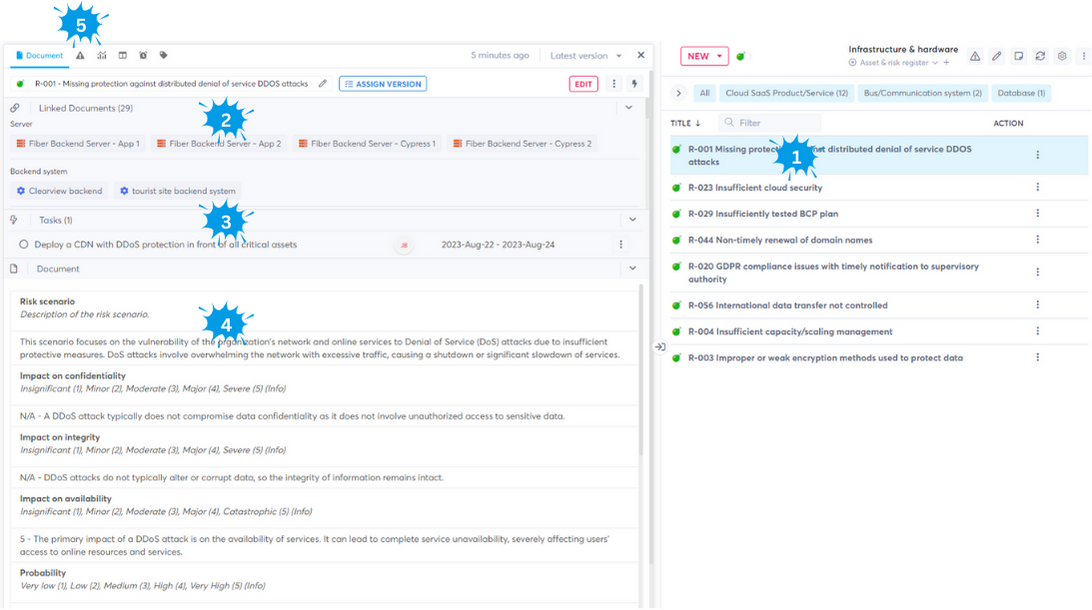
- Here is a list of risk documents grouped into the "Infrastructure & hardware" folder, where you can quickly see their unique identifier. In this case we selected risk R-001 which opens on the left of the screen
- In the Linked Documents area, you can see that this risk is linked to 29 different other documents (assets, suppliers, servers, backend systems, ...) which is a bi-directional link allowing you to visually track dependencies
- In the tasks section you will see individual tasks linked to this risk document which can be managed and grouped as explained in the Task management documentation
- This is the template filled in with the initial risk description coming out of your risk assessment. This template can be updated in line with your needs and methodology
- Each document has a risks tab that allows to visualize the individual evolution of the risk on the current document which is shown in more detail at the bottom of this article
How to do risk readings
Companies generally manage many different types of risks (e.g. CIA risks, Business risks, supplier risks, Employee risks, non-conformity risks, etc). And because everything is simply a document in Brainframe, we allow you to do risk readings on any document of your choice allowing you full flexibility of what you want to trace. Before you do an actual risk reading on a document (e.g. the risk document from the previous paragraph), it is just a document. Only as soon as a first risk reading has been done, it will be represented on your risk matrix and tracked in time.
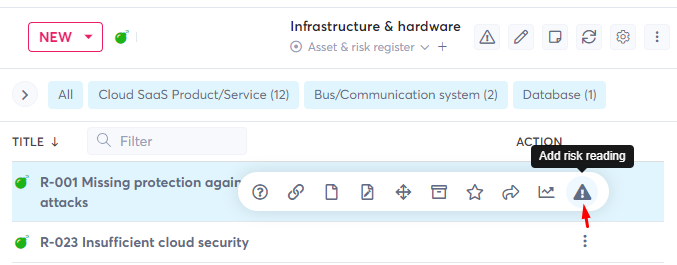
To add a risk reading on a document, you simply select the 3 dots on the right of the document name, and click the triangle icon:
Which directly opens the risk tab. If this is the first risk reading, you will be presented with a selection screen for the risk type you want to use (you can define your own custom risk types if you want)
Once you select a risk type (e.g. confidentiality, integrity and availability risk), you are presented with following risk overview screen:
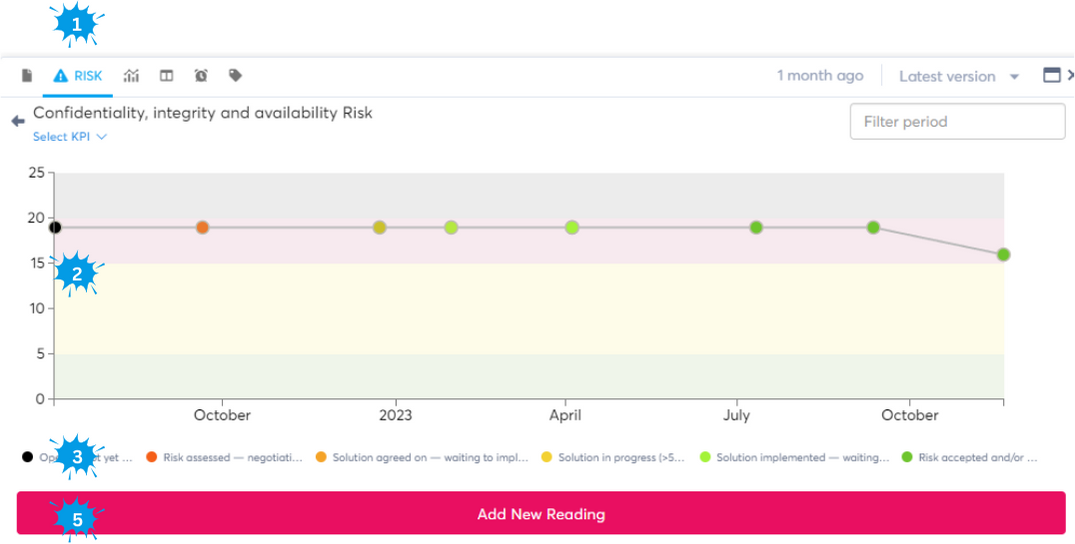
- The risk tab available on every document
- The risk evolution in time for this risk type on this document (this will not be shown if there is no reading)
- The legend of remaining work colors used in the risk evolution
- Click this button to add a new reading on this document
By clicking "Add new risk reading" (4), the following "Add reading" area will become visible:
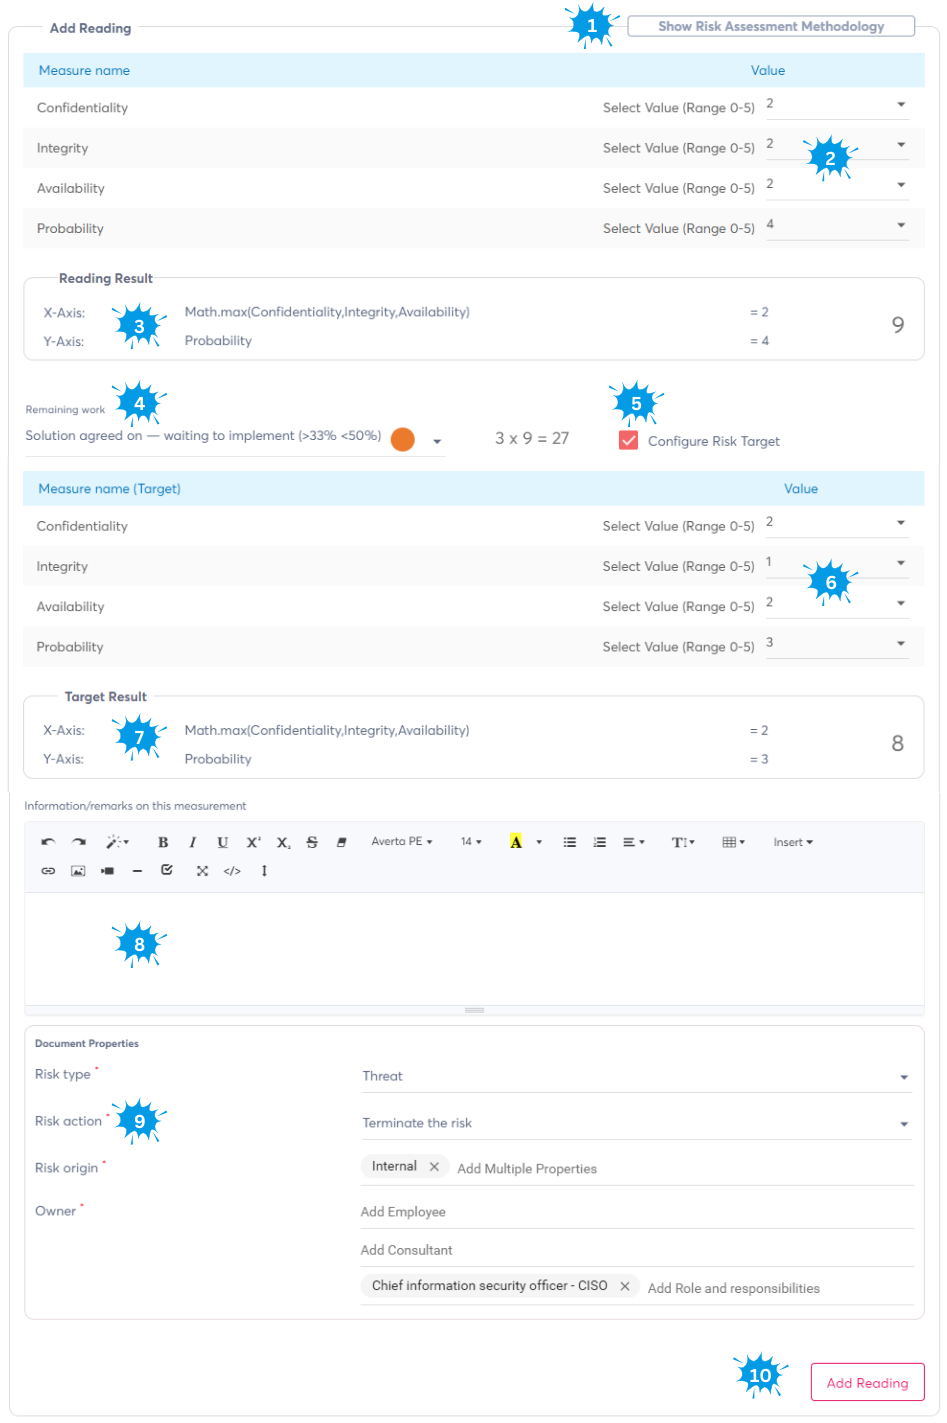
- When you click here, you can show the risk assessment methodology that has been defined
- Here you provide the individual measures that are used to calculate the risk by selecting a value in the dropdown in line with the methodology
- The different risk readings are configured to map either to the X (impact) or Y (probability) axis on the risk matrix. Here you see the calculation, including the calculated risk level from 1-25 for a 5x5 matrix (e.g. 9)
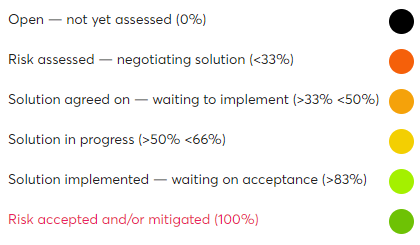
- To facilitate tracking progress on your risk work, we added a simple but effective "Remaining work" tracking that multiplies your actual risk (e.g. 9) by a number from 5 to 0 (e.g. 3). When the risk is open/not assessed the multiplier is 5, when all identified mitigation work has been done or the remaining risk is accepted, the risk is multiplied by 0. Take note of the different colors since they will be used in many other screens as explained later in this document
- You can optionally choose to also configure a target risk by checking this box. Once checked, you will see (6) and (7)
- These are the target risk measures you are aiming for with after your mitigations have been implemented
- Similar to the normal measures, this calculates how the target risk will be calculated in the future (e.g. 8)
- This is a free text field in which you can justify your risk evaluation change, including inserting evidence like pictures or files. A Full history of your readings will be available as explained below
- Risk types can be configured to require specific document properties to be collected. If the document on which you do a risk reading already had document properties configured, they will be pre-filled, otherwise you will be required/asked to fill them in
- Once you click on Add risk reading, you can add a new reading that is shown on the risk evolution tab
INFO
Risk evaluations where the measures result in a 0 risk calculation, indicate that the risk is effectively closed. In that case the "Add reading" button will change into "Close RISK"
INFO
Each risk reading creates a new document that represents the reading and evidences in the same folder as where the document of the risk is residing. This also allows you to "archive" or modify the details of a wrong risk readings
Risk evolution
Each document with risks readings will store the full history of readings per risk type, and you can visualize this from the risk tab on any document:
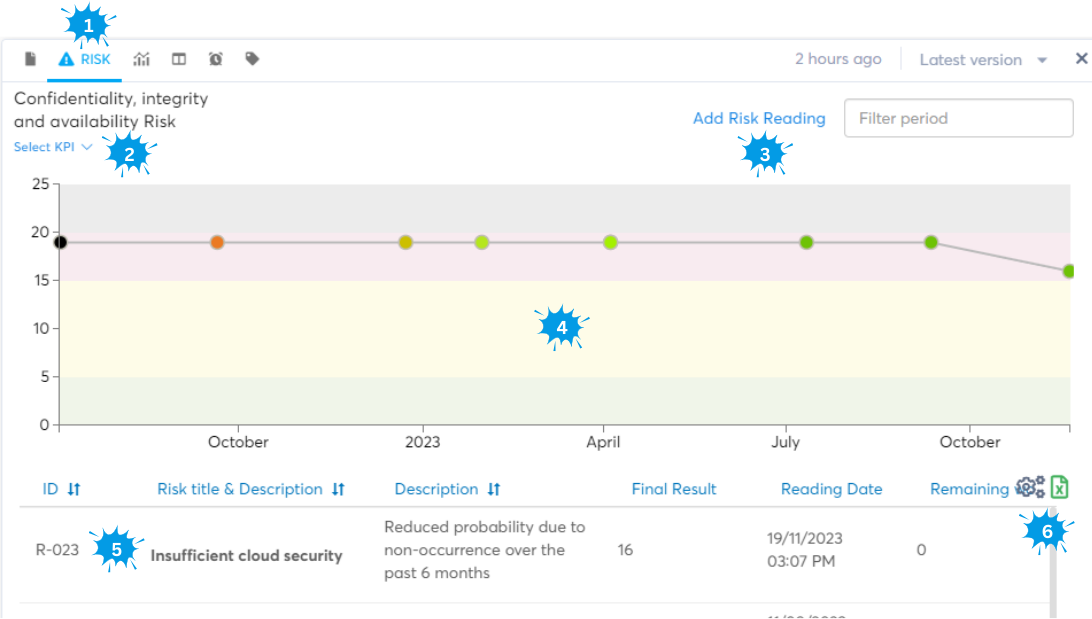
- The risk tab present on any document
- Here you see which risk type is selected (you can use the dropdown to select another one)
- Here you can add new readings
- This is the timeline (X: time, Y: 0-25 of risk) which is divided into the vertical green, yellow, red and black risk areas to quickly see their importance in line with your risk appetite. Notice the different dots and their colors. This indicates the remaining work explained in the beginning of this document. By hovering over the dots you'll see more details on the specific reading.
- Here you will find the different details about individual risk readings, with the most recent one on top.
- Using the configuration button, you can specify which columns need to be shown in the readings table. By clicking the Excel icon you can export the table into an Excel file
Risk overview
Our risk module embraces a qualitative risk management strategy, which prioritizes the evaluation of risks based on their potential impact and the likelihood of their occurrence. This subjective, scenario-based approach is both easier and faster than quantitative risk management, and allows for a pragmatic prioritization of each risk facilitating more strategic decision-making. Based on a consistent risk assessment methodology and your risk appetite, you will be able to quickly visualize all your risks on an intuitive 1-25 risk matrix. By selecting the risks module, you first need to select the risk type (which has different measures)
This will then open the risk matrix that visualizes all risks in the currently selected folder and items in it's subfolders.
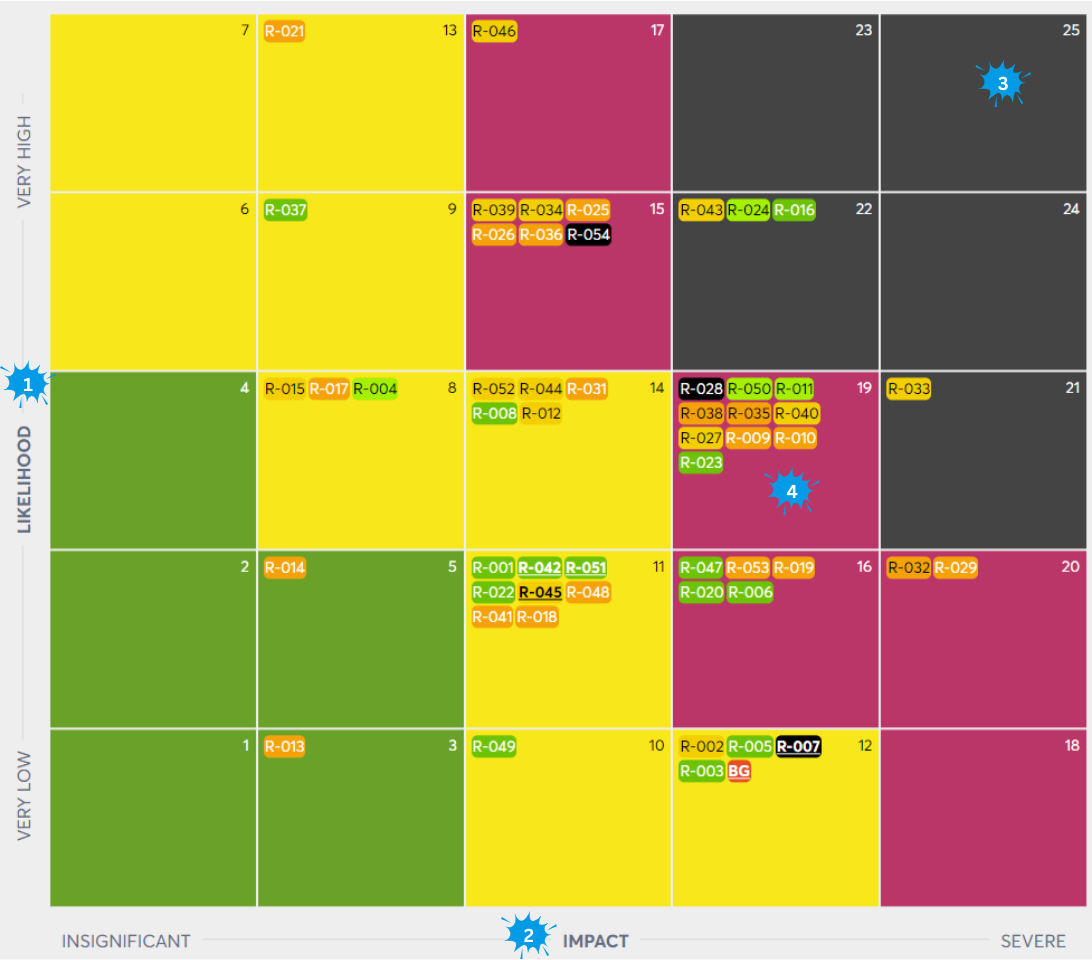
One image speaks a thousand words, and that is why in Brainframe we try to give you multiple ways to look at the same information. In the risk matrix above you can find back following elements:
- The Y axis represents the Likelihood of your risk. In your risk assessment methodology you'll define what each 1-5 level represents and how which measures are used to define it. By being consistent in your assessment methodology, you can ensure that each risk on the matrix is evaluated in the same way and its importance can be compared to other risks.
- The X axis represents the Impact of your risk. This is often uses multiple measures to define (eg. confidentiality, integrity and availability impact)
- 25 is the maximum risk level on our matrix, and as you quickly notice above, we use colors to visualize 4 levels of importance in line with your risk appetite
- green - low level risks with an evaluation between 1-5 (requiring new readings once a year, otherwise risks start flashing)
- yellow - medium level risks with an evaluation between 6-14 (requiring new readings every 6 months)
- red - high level risks with an evaluation between 15-20 which are considered above your risk appetite (requiring new readings every 3 months)
- black - critical level risks with an evaluation between 21-25 which are considered the top priority (requiring new readings every month)
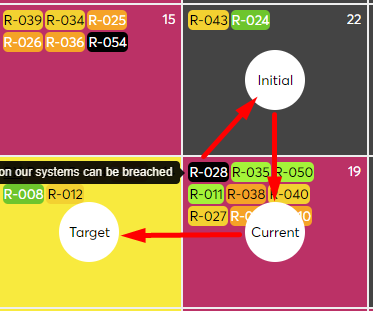
- The risk level 19 square indicates these risks have an impact of 4 and a likelihood of 3. The risk identifiers represent the different risks, and their individual colors represent the level of remaining work needed to mitigate them so that at a glance you can see the status of all your risks. By hovering over the different risks you'll see the full title of the risk. The colors of the risks represent the remaining work we explained earlier in this document, giving you a quick view on what needs action
When hovering over the different risks, you will be able to see their initial risk reading, current risk reading, and when defined, their target risk reading
TIP
Notice that some risks are underlined. This indicates they have no mitigation deadline is configured in the planning tab of the document
TIP
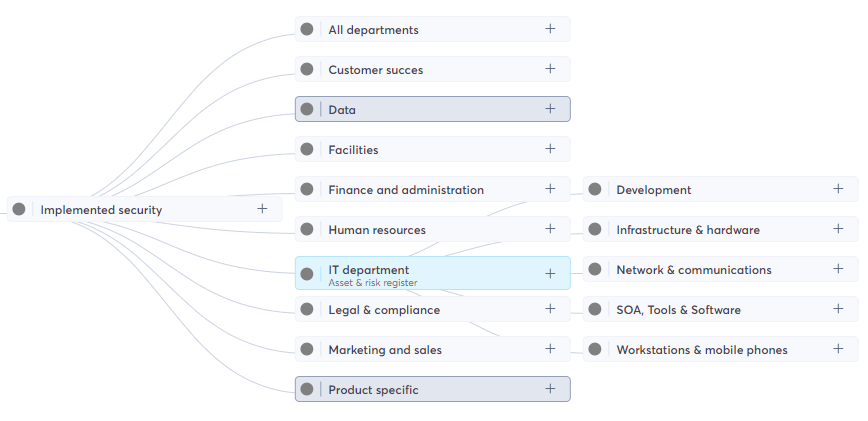
Because documents that represent risks can live in more than one folder, you get full flexibility to LINK the document to dedicated department/product/service folders. Because the risk module only shows risks of a specific type in the current folder and its subfolders, you can quickly visualize only risks for a specific folder. Below is an example of folders organized per department. By selecting only the "IT Department" folder, the risk matrix, workbench and overview tabs will only show documents and risk in that folder and its subfolder
Reporting and evolution
The essence of effective risk management lies in continuous monitoring and adaptation. Our module is engineered to provide a good perspective on risk, tracking the evolution of each identified risk over time, and showing risk reduction for the future based on planned mitigations. This persistent tracking empowers your organization to not only respond to current threats but also to anticipate and prepare for future vulnerabilities.
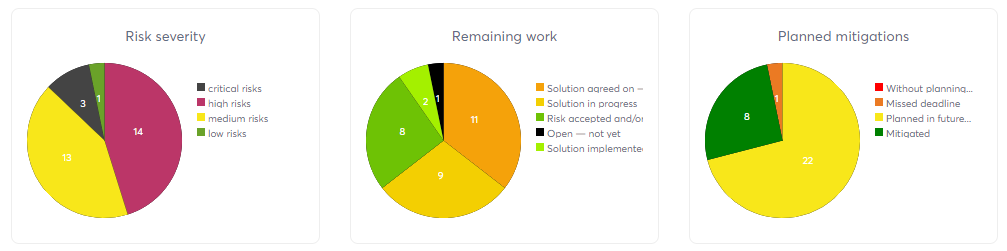
On top of the risk matrix you see an overview of all different risks visualized on the matrix, giving you a quick insight on the risk severity, remaining work and levels of planned mitigations. By clicking on any of the graph sections, the contents on the risk matrix will be filtered accordingly
Below the risk matrix, you'll find a listing of all the latest readings and their properties, which can also be exported to Excel for additional reporting if needed.
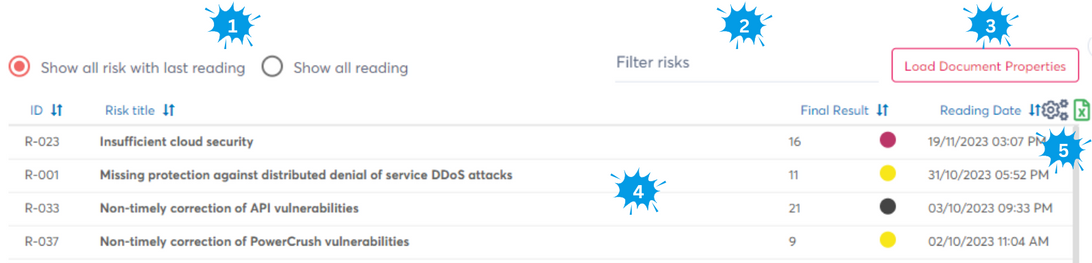
- Select if you only want to see the latest reading in the list, or all readings
- Quickly filter the list and matrix on the unique identifier, title
- Load the document properties linked to each risk, e.g.:
- This is the list of all risks based on the applied filters
- By selecting on the configuration icon, you can indicate which columns should be shown in the risk list. By clicking the Excel icon, you can export the different columns and data shown in the list
At the bottom of the page you can generate a risk evolution graph based on the configured remaining work and future planning. This graph again only shows risks in the current folder and subfolders, allowing you to quickly visualize the risk evolution per department, product, service, ...
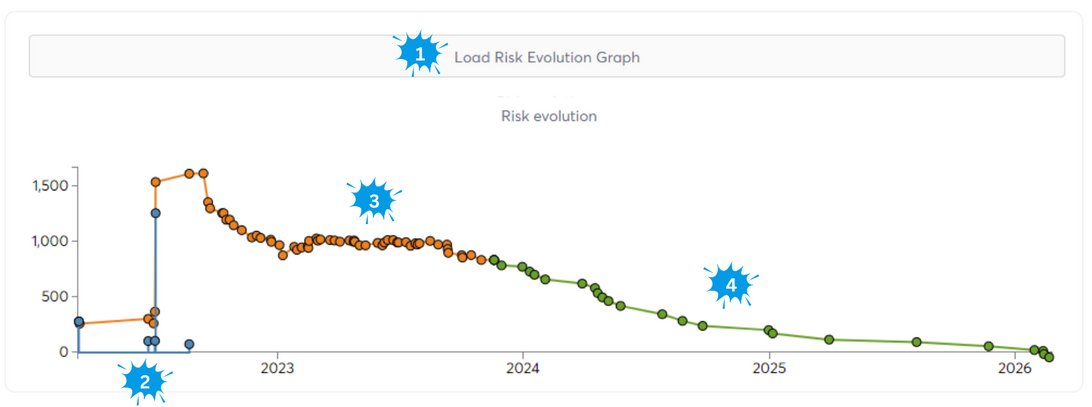
- Click to generate the Risk evolution graph
- Blue dots indicate newly added risks (first risk reading)
- The orange dots indicate the sum of all risks multiplied with their remaining work, giving you a nice visualization of the residual risks
- The green dots show risks that have a date planned for the future, allowing you to visualize to management and auditors how your risk mitigation planning will evolve over time
TIP
By hovering over any of the dots on the graph, you will see relevant information about the risks that changed on that date
Risks on the workbench
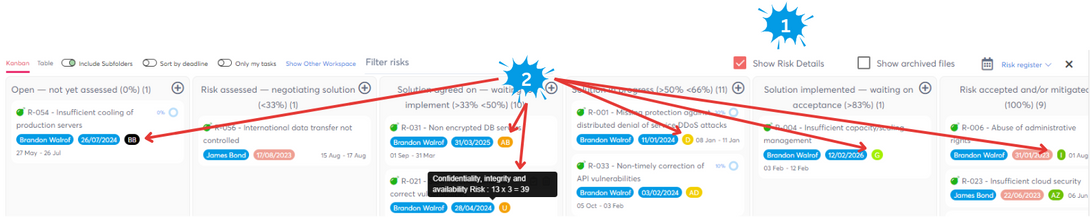
Visualization is key to comprehending and managing your risk landscape. By adding risk documents to a checklist (e.g. Risk register) on our intuitive Kanban process workbench, you can visualize information from the risk matrix on a clear and actionable board that is easier to understand and work with for different stakeholders (e.g. Infrastructure responsible). From there you can easily organize, prioritize, and update risks at a glance. Each risk card can be moved through stages that represent your workflow, from initial identification to resolution.
TIP
Did you know that when configuring custom risk types, you can link the "Remaining work" stages to the actual Kanban stages of a workbench checklist. When this is enabled, moving cards on the workbench will ask to do a new risk reading and update the remaining work accordingly. In the risk reading details it will show that this reading was done from the workbench